Project Goal
To segment customers and analyze their demographics and purchase behavior to enhance marketing strategies and improve customer lifetime value (CLV).
Problem & Motivation
Customer Lifetime Value (CLV) provides critical insights into customer relationships, enabling targeted marketing and optimized investments.
Challenge: Calculating CLV requires complex data integration, interdisciplinary collaboration, and time-consuming analysis.
Solution: The RFM Model
Recency (R): How recently did customers purchase?
Frequency (F): How often do they buy?
Monetary Value (M): What is their spending value?
It was Done in 3 Steps
Step 1: Building the Foundation — Introducing the RFM Model
This step was all about setting the stage for strategic CLV analysis using the RFM (Recency, Frequency, Monetary) framework. It involved understanding the business context, pitching the concept, and coordinating data collection efforts across departments.
Pitch to Stakeholders
To initiate the project, I pitched the RFM model to the management team, emphasizing:
" How recent customers are more likely to engage.
How frequency correlates with loyalty and retention.
How monetary value pinpoints high-spending customers.
The potential for more targeted campaigns and better ROI through segmentation."
Challenges Addressed
Ensuring the recency calculation aligns with our business cycle — considered using months instead of days.
Handling frequency distortion due to session-level vs. product-level bookings.
Addressing monetary inconsistencies, especially from B2B clients or bulk transactions.
Cross-functional Collaboration
Data collection was initiated in collaboration with:
Sales/CRM for customer transaction history.
Product teams for service-level purchase granularity.
Data Engineering to support hashing IDs and booking session structuring.
Step 2: Historical CLV Calculation
In this step, I moved from segmentation to quantifying Customer Lifetime Value (CLV) using a historical model. This involved consolidating cost and behavioral data to calculate the actual profitability of customer groups segmented via RFM.
Costs of Acquisition
Includes both direct and indirect expenses involved in acquiring and retaining a customer:
General Costs for running the services and systems
Marketing Costs (ads, promotions, outreach)
System Maintenance Costs related to keeping the platform/service functional
Customer Care costs (support teams, ticketing systems)
Average Order Value (AOV)
Formula:
AOV = Total Revenue from Customers (last 5 years) ÷ Number of Bookings
AOV = Total Revenue from Customers (last 5 years) ÷ Number of Bookings
Challenges:
Ensuring revenue only includes relevant transactions (e.g., exclude internal/bulk/biz clients)
Normalizing revenue across different service tiers or regions
Dealing with missing or inconsistent transaction records
Purchase Frequency
Represents how often customers return to book during a defined period (e.g., annually).
Challenges:
Defining an appropriate timeframe (e.g., yearly vs. quarterly)
Handling seasonal patterns or inactive periods
Excluding one-time promotional users who skew frequency
Customer's Average Lifespan
Measures the average duration a customer stays active (makes at least one booking).
Challenges:
Identifying the true “last activity” — is inactivity final or just temporary?
Accounting for long gaps between bookings in slow cycles
Differentiating churned users from dormant users
Step 3: Predictive CLV Calculation
With historical data in place, this final step projected Customer Lifetime Value (CLV) into the future using a predictive approach — helping the business make forward-looking decisions grounded in financial modeling.
Discount Rate Factors:
To accurately forecast long-term value, I factored in time value of money using a discount rate that reflects market dynamics:
Inflation – Erosion of future earnings due to rising prices
Cost of Money / Interest Rates – Opportunity cost of capital tied up in customer acquisition and retention
Market Convention – Typically, a discount rate of 10% is used for CLV modeling in mature markets
This helps ensure that the predicted value accounts for real-world economic depreciation.
Method:
I applied the formula:
Predictive CLV =
∑t=1T(AOV×Frequency×Retentiont)(1+Discount Rate)t\sum_{t=1}^{T} \frac{(AOV \times Frequency \times Retention^t)}{(1 + Discount\ Rate)^t}t=1∑T(1+Discount Rate)t(AOV×Frequency×Retention)
Where:
AOV = Average Order Value
Frequency = Expected purchases per year
Retention = Estimated probability of customer staying each year
T = Forecast period (in years)
Challenges:
Choosing an appropriate forecast horizon (e.g., 3–5 years)
Estimating retention rate over time using historical churn trends
Accounting for customer behavior variability in uncertain economic conditions
Handling segment-specific discounting, especially for B2B vs. B2C groups
OUTCOMES
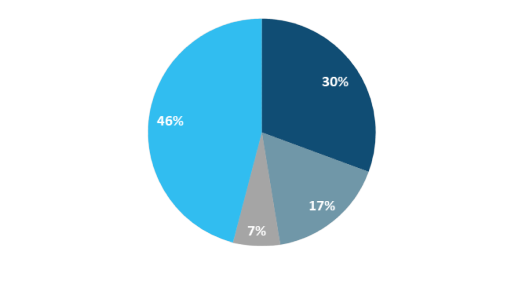
Recency
The business is recovering after the pandemic.
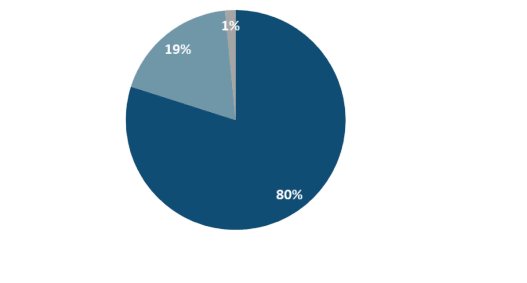
FREQUENCY
Low customer retention rate of 20%.
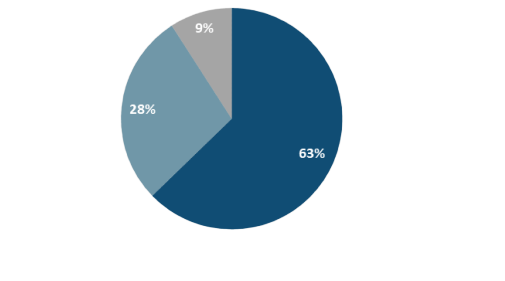
MONETARY
Most Average Order Value (AOV) is up to €80 (net revenue).
Explore my braze implementation project for better customer engagement.
